Troubleshooting Cody
Learn about common reasons for errors that you might run into when using Cody and how to troubleshoot them.
If you encounter errors or bugs while using Cody, try applying these troubleshooting methods to understand and configure the issue better. If the problem persists, you can report Cody bugs using the issue tracker or ask in the Discord channel.
VS Code extension
Cody is not responding in chat
If you're experiencing issues with Cody not responding in chat, follow these steps:
- Ensure you have the latest version of the Cody VS Code extension. Use the VS Code command
Extensions: Check for Extension Updatesto verify - Check the VS Code error console for relevant error messages. To open it, run the VS Code command
Developer: Toggle Developer Toolsand then look in theConsolefor relevant messages
Access Cody logs
VS Code logs can be accessed via the Outputs view. To access logs, you need to enable Cody logs in verbose mode. To do so:
- Go to the Cody Extension Settings and enable:
Cody › Debug: EnableandCody › Debug: Verbose - Restart or reload your VS Code editor
- You can now see the logs in the Outputs view
- Open the view via the menu bar:
View > Output - Select Cody by Sourcegraph from the dropdown list

Errors trying to install Cody on macOS
If you encounter the following errors:
Command 'Cody: Set Access Token' resulted in an error

Command 'cody.set-access-token' not found
Follow these steps to resolve the issue:
- Close your VS Code editor
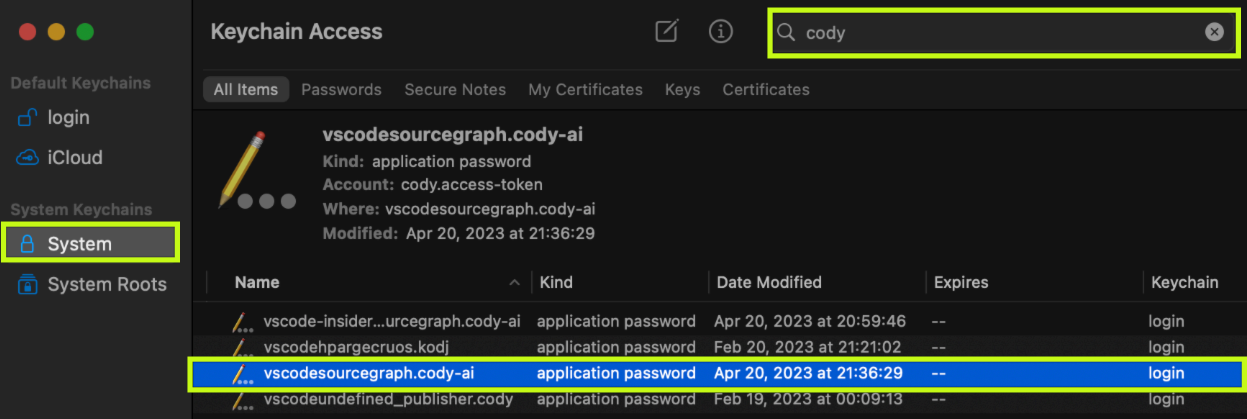
- Open your Keychain Access app
- Search for
cody - Delete the
vscodesourcegraph.cody-aientry in the system keychain on the left - Reopen the VS Code editor. This should resolve the error

Signin fails on each VS Code restart
If you find yourself being automatically signed out of Cody every time you restart VS Code, and suspect it's due to keychain authentication issues, you can address this by following the steps provided in the official VS Code documentation on troubleshooting keychain issues. These guidelines should help you troubleshoot and resolve any keychain-related authentication issues, ensuring a seamless experience with Cody on VS Code.
No context files were included by Cody
If Cody is not responding with answers relevant to your codebase, it might be missing context files. To make sure that context files are included, follow these steps:
- From your Cody chat window enable the checkbox for Enhanced Context panel
- Next, go to the Output log panel in VS Code and select Cody by Sourcegraph from the dropdown menu
- Finally, copy the output log. We're specifically looking for log messages like these:
█ SimpleChatPanelProvider: getEnhancedContext > embeddings (start)
█ SimpleChatPanelProvider: getEnhancedContext > searching local embeddings
█ SimpleChatPanelProvider: getEnhancedContext > embeddings (end)
█ SimpleChatPanelProvider: getEnhancedContext > search
█ symf: using downloaded symf "/Users/beyang/Library/Application Support/Code/User/globalStorage/sourcegraph.cody-ai/symf/symf-v0.0.6-aarch64-macos"
█ SimpleChatPanelProvider: getEnhancedContext > search (end)
█ DefaultPrompter.makePrompt: Ignored 8 additional context items due to limit reached
Rate limits
On the free plan, Cody provides 500 autocomplete suggestions and 20 chat and command invokations per user per month.
On the Pro and Enterprise plans, there are much higher limits that are used to keep our services operational. These limits reset within a day.
Error logging in VS Code on Linux
If you encounter difficulties logging in to Cody on Linux using your Sourcegraph instance URL, along with a valid access token, and notice that the sign-in process in VS Code hangs, it might be related to underlying networking rules concerning SSL certificates.
To address this, follow these steps:
- Close your VS Code editor
- In your terminal, type and run the following command:
echo "export NODE_TLS_REJECT_UNAUTHORIZED=0">> ~/.bashrc - Restart VS Code and try the sign in process again
Error exceeding localStorage quota
When using Cody chat, you may come across this error:
Failed to execute 'setItem' on 'Storage': Setting the value of 'user-history:$user_id' exceeded the quota.This error indicates that the chat history size surpasses the capacity of your browser's local storage. Cody stores comprehensive context data with each chat message, contributing to this limitation.
To fix this, navigate to https://sourcegraph.example.com/cody/chat and click Clear Chat History if your instance is on v5.2.3+. For older versions, clear your browsing data or browser history.
Record performance traces for Cody
You can get performance traces from the Cody VS Code extension in production with full support for source maps. To do so:
- Start VS Code with a special runtime flag. In macOS, you can do so via the terminal like this:
/Applications/Visual\ Studio\ Code.app/Contents/MacOS/Electron --inspect-extensions=9333Note that you may need to quit VSCode first, then run that command to re-launch it. It will open all of your windows and tabs again.
- After VS Code is started, head over to Chrome and go to
chrome://inspect, which takes you to the following:
- Configure the inspect server you started on port
9333from here. To do so, click on Open dedicated DevTools for Node, then go to the Connection tab, and make sure to addlocalhost:9333to the list
- Now head back to the
chrome://inspecttab, and you should see a new remote target that you can inspect
- Clicking this will open a (somewhat reduced) DevTools view. Great! We've almost got it. From here you can go to the Performance tab to record a trace. And finally, swap tabs to the VS Code window and interact with the extension. Come back later to stop the recording and export it.
JetBrains IntelliJ extension
Access Cody logs
JetBrains logs can be accessed via the Output panel. To access logs, you must first enable Cody logs from the Settings menu. To do so:
- Open the Settings panel (⌘, for MacOS) (Ctrl Alt 0S for Windows)
- Go to
Sourcegraph & Cody - Click on
Cody - Check the box to Enable debug
- Optionally, select the box to enable Verbose debug
- Click Apply
- To access the logs, go to Help - Show Log in Finder
- Open the
idea.logfile